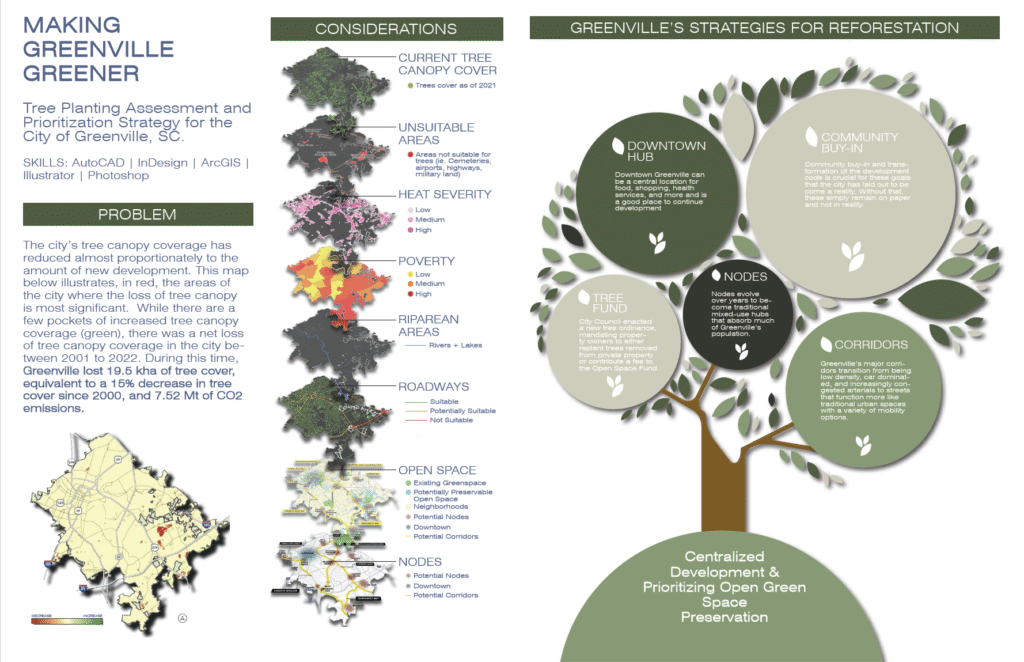
Celia Castellano, a graduate student in Clemson’s Master of Landscape Architecture program, received first place in Clemson Libraries’ first-ever Graduate Student Data Visualization Competition for her project “Making Greenville Greener.”
The competition gave graduate students a chance to showcase their skills in creating visual representations and presentations of data. Castellano’s winning entry presented data from a tree planting assessment for prioritization strategy for the City of Greenville. She used AutoCAD, InDesign, ArcGIS, Adobe Illustrator and Adobe Photoshop to create her visualizations.
“Celia’s submission stood out for its thoughtful, holistic presentation of tree-planting policy considerations. The project clearly communicates the complexity of the issue, guiding the viewer through multiple dimensions with clarity and purpose,” wrote the judges. “The visual language is cohesive, stylistically consistent and accessible throughout. The narrative flow is smooth and well-structured, with design choices that enhance understanding and maintain focus. Overall, this is a polished and well-executed piece that demonstrates strong conceptual framing and visual coherence.”
Castellano received her bachelor’s degree from Furman University in sustainability science.

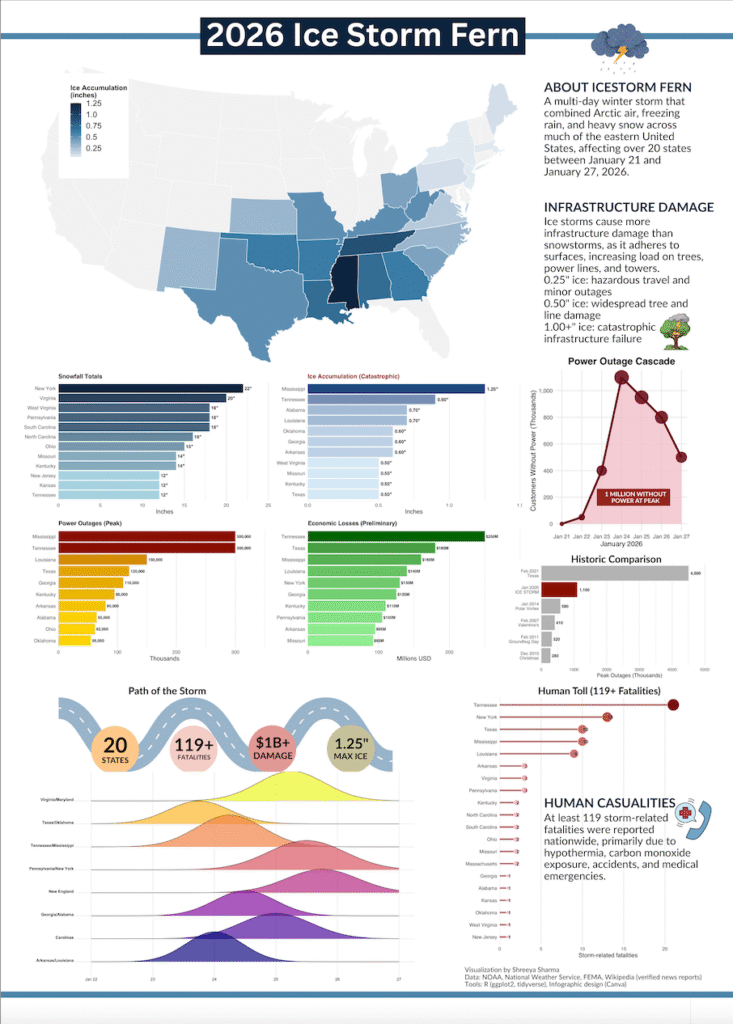
Second place went to Shreeya Sharma, a graduate student in animal and veterinary sciences, for her graphic illustrating the impact of the January 2026 Ice Storm Fern. Sharma’s project detailed ice accumulation, power outages, infrastructure damage and other impacts of the storm, which struck the southeast between January 21-26. She used R and Canva to create her presentation.
The judges’ comments said, “Shreeya’s work features clear, well-designed visualizations that effectively support and complement the overall narrative. Each component contributes meaningfully to the story, showcasing strong design skills and thoughtful construction. The infographic brings together substantial information in a cohesive format, reflecting careful attention to detail and analytical depth. The “Path of the Storm” visualization, in particular, introduces a dynamic element that adds visual interest and strengthens the project’s storytelling dimension.”
Sharma earned a bachelor’s in veterinary sciences from Purbanchal University in Nepal.
Emily Port, a Ph.D. student in visual computing, received third place in the competition for her visualization titled “Player Drops in Call of Duty: Warzone Caldera,” which looked at where players of the video game “Call of Duty: Warzone” choose to drop into the game map upon deployment or redeployment.
“Emily’s submission demonstrates strong technical capability and engagement with a complex dataset. Working with geometric data adds an additional layer of sophistication, requiring substantial preprocessing and data transformation before visualization. The visualizations are technically sound and use appropriate visual channels to communicate key insights. This project stands out for the depth of data work involved and the ambition of tackling more complex data structures, reflecting impressive analytical effort and execution,” wrote the judges about Port’s work.
Port earned a bachelor’s degree in digital information design from Winthrop University and a master’s in modeling in simulation from the University of Central Florida.

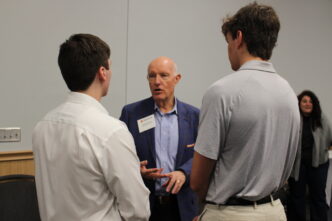
This competition was hosted by the Data Visualization Lab and sponsored by the Clemson University Graduate School, the School of Mechanical and Automotive Engineering, the College of Science and the Department of Industrial Engineering.
The Data Visualization Lab is a collaborative space in Cooper Library where students, faculty and staff can enhance their skills in data visualization, data analysis and digital research methods.